EV Energy Use: Why the Car’s Dashboard and Your Electricity Meter Differ
Your car reports one energy figure, the charger app another, and the electricity bill a third. That mismatch does not automatically mean the charger is faulty or the battery has degraded.
LLightning Energy TeamLightning Energy25 October 2026 · 5 min read
Your car reports one energy figure, the charger app another, and the electricity bill a third. That mismatch does not automatically mean the charger is faulty or the battery has degraded.
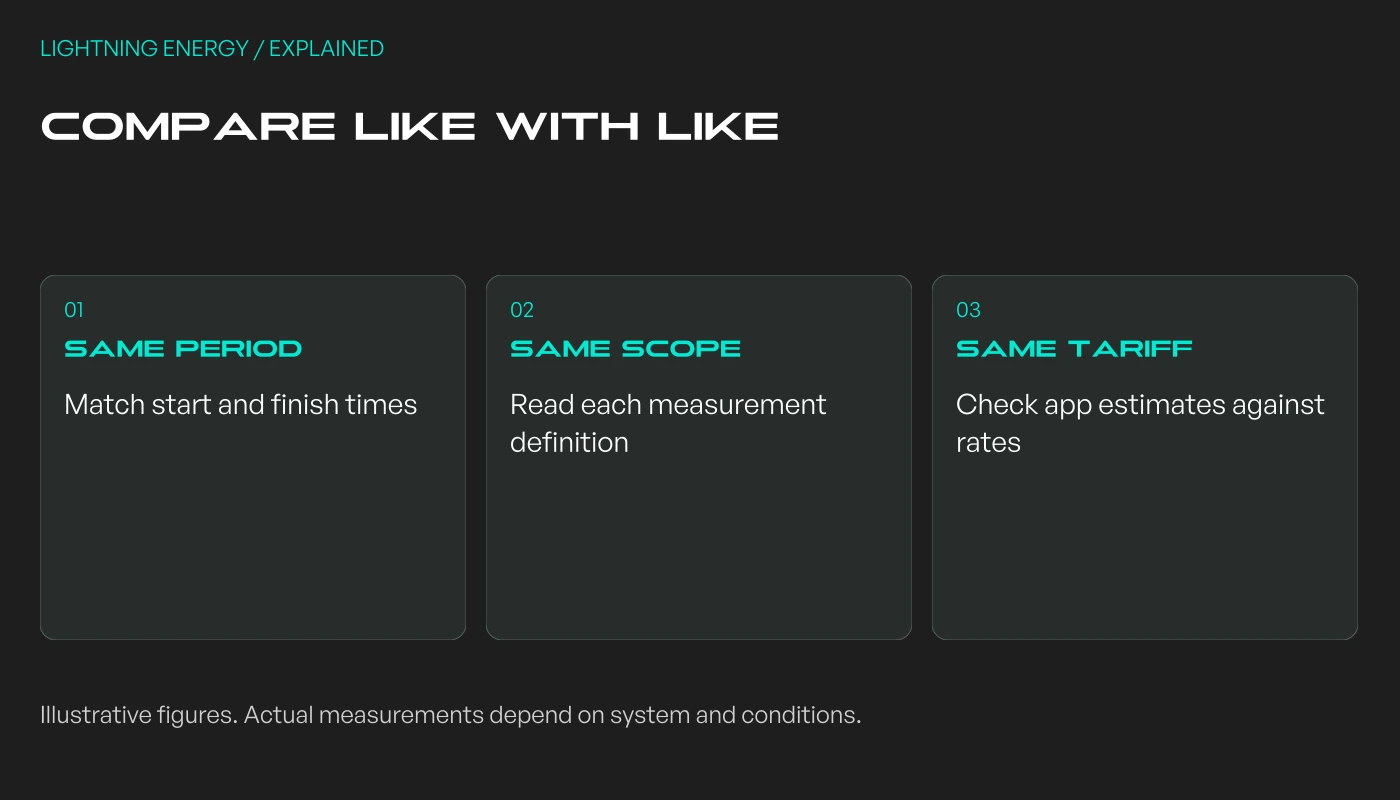
First ask what each number measures and whether the time periods match. Energy entering the property, entering the charger, reaching the battery and being used while driving are different quantities.
Draw the measurement boundaries
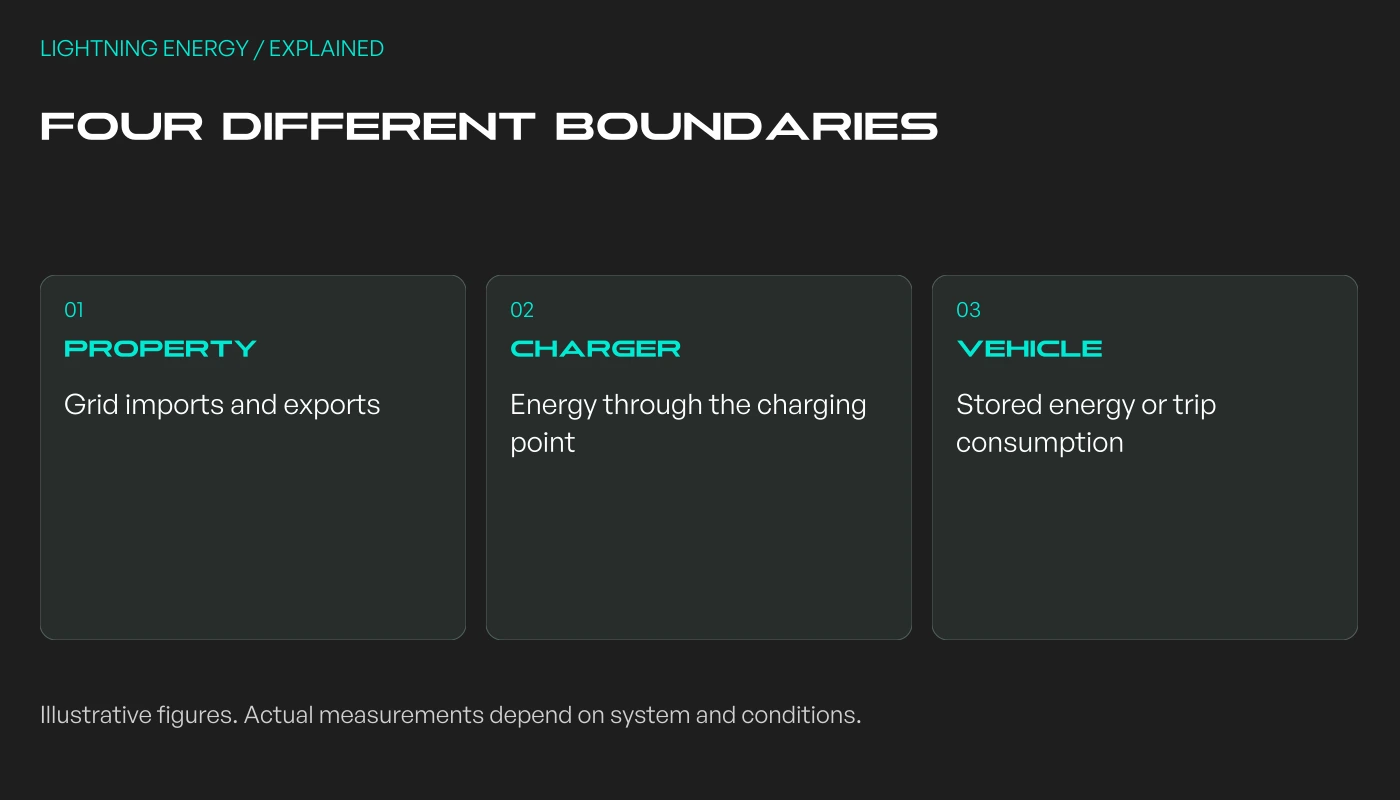
A household electricity meter records grid imports and exports. It also reflects other household loads. A charger measurement has a narrower boundary, while the vehicle's driving display may describe energy used over a trip.
Some energy also supports charging and battery temperature management.
For home EV charging, compare definitions before comparing totals. An app label such as “energy added” needs its manufacturer's explanation, not an assumption that it is identical to the bill.
Illustrative figures. Actual measurements depend on system and conditions.
Use a matched-period example
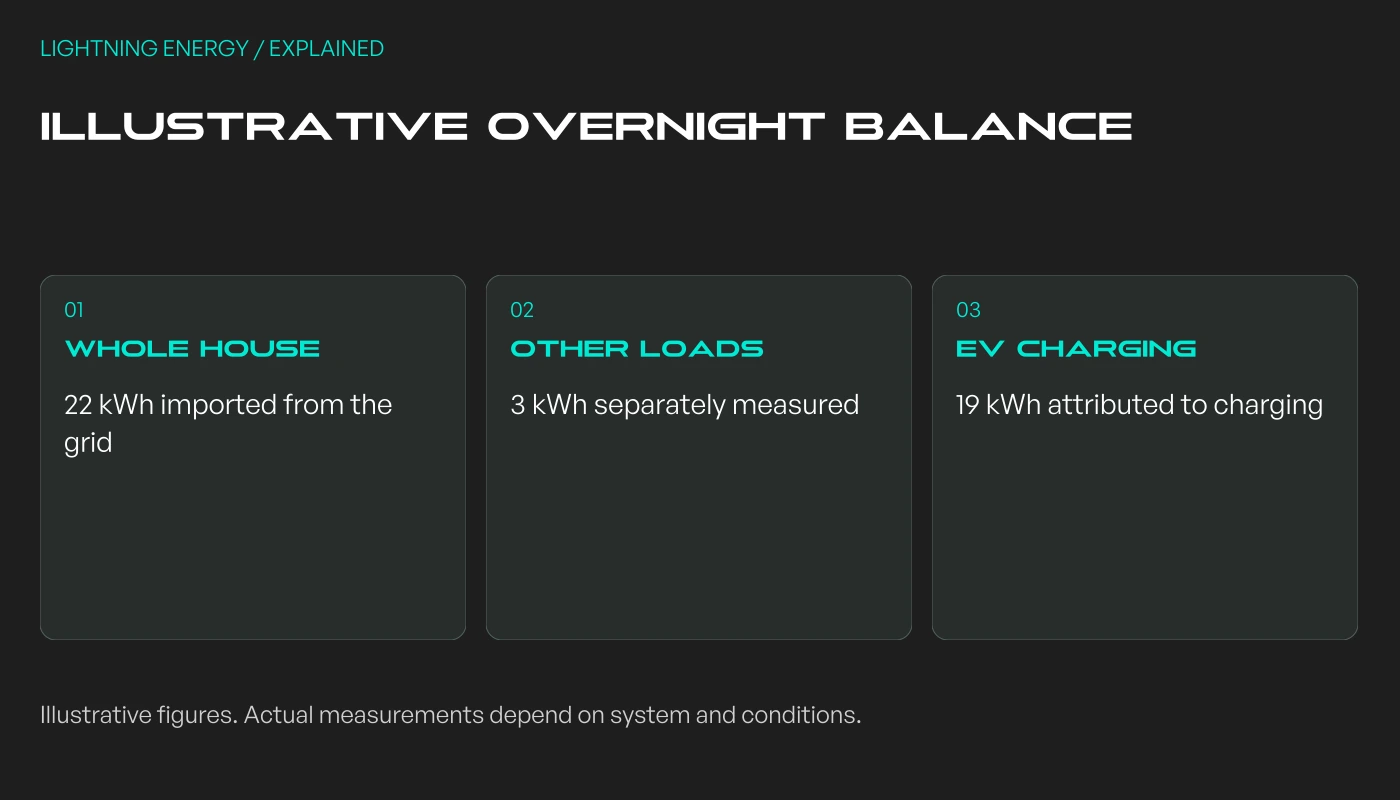
Consider a fictional overnight period with no solar generation or home-battery contribution. The house imports 22 kWh. Separately measured non-EV loads use 3 kWh, leaving 19 kWh attributable to charging.
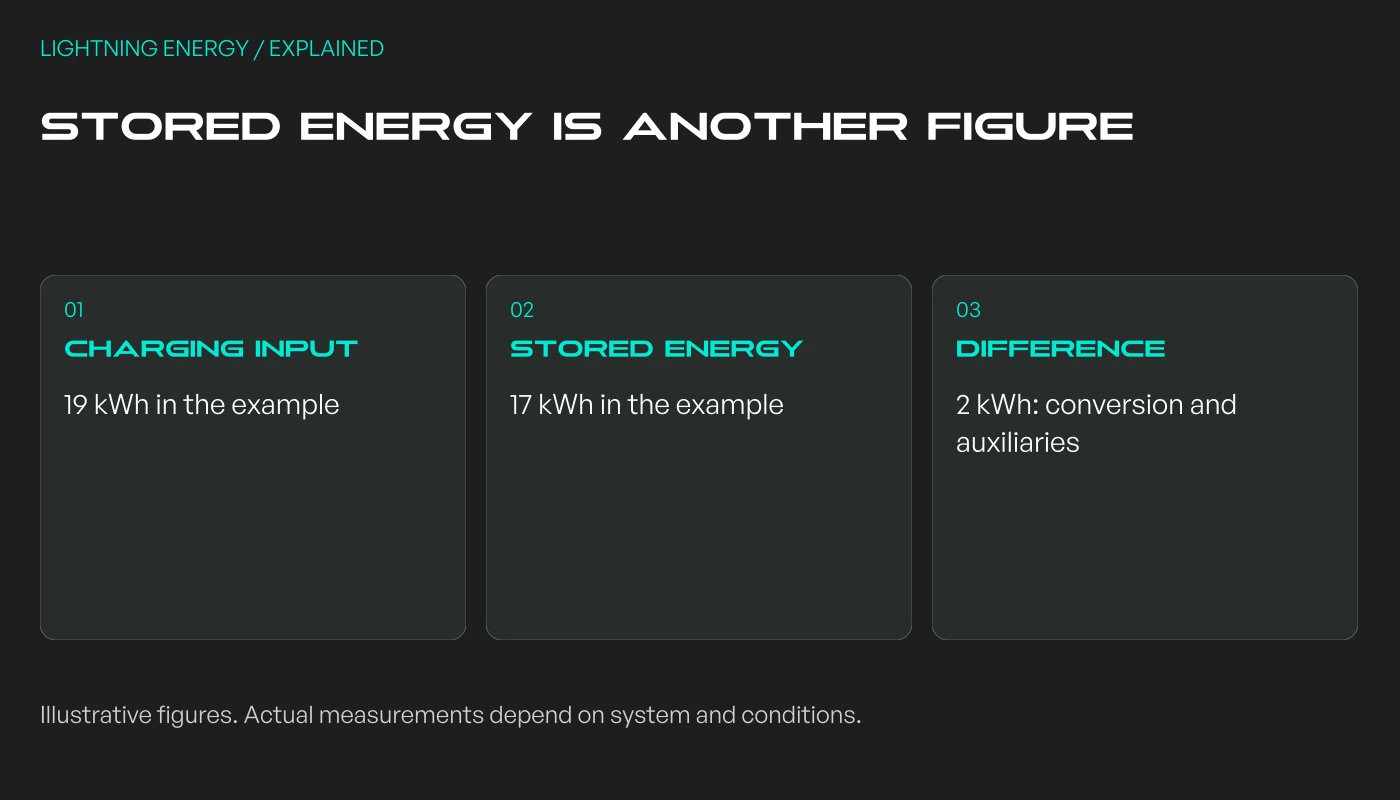
Suppose a compatible vehicle report indicates 17 kWh stored over that same period.
The 2 kWh difference might include conversion and auxiliary consumption.
This is an illustrative energy balance, not a universal loss rate or diagnostic test.
If the non-EV load was guessed, or the vehicle number used a different definition, that calculation would be less reliable. A change in battery percentage alone is not a precision energy meter.
Illustrative figures. Actual measurements depend on system and conditions.
Solar makes grid import an incomplete EV total
With rooftop solar, the charger may receive electricity that never appears as grid import. A home battery can also supply some of the energy, with its own charging history and losses.
Avoid subtracting today's grid bill from the car display and calling the difference efficiency. You need consistent measurements of the relevant flows over the same interval.
A whole-home chart is useful for spotting when charging happened. It cannot always isolate the vehicle from cooking, heating or other loads operating at the same time.
Illustrative figures. Actual measurements depend on system and conditions.
Its kilometres-added figure is an estimate based on model efficiency in ideal conditions, not an odometer reading.
Check your own vehicle and charger documentation for equivalent definitions. Update app prices when your retail plan changes, and distinguish estimates from the retailer's actual billed charges.
For a practical running-cost calculation, use charging expenditure and kilometres travelled over a representative period. Explain whether public charging, solar opportunity cost and daily household supply charges are included.
Illustrative figures. Actual measurements depend on system and conditions.
Investigate a change, not just a difference
Keep screenshots of start and finish times, charger energy, vehicle reports and relevant weather or temperature conditions. Compare several similar sessions rather than diagnosing a system from one short top-up.
Unexpected interruptions, warning messages or a repeated unexplained change deserve attention. Contact the equipment supplier with the records; do not open the charger or attempt electrical fault-finding yourself.
Ask Lightning Energy about monitoring during the installation discussion. Knowing which measurements the system provides is more useful than expecting every screen to show the same number.
Book a consultation and we'll map solar, storage, hot water, and the rebates around your bills and your goals.
Loading consultations…
Lightning EnergyPlan your next energy upgrade.
⚡
Hi, I’m Lightning Energy’s project guide. I’ll ask a few practical questions, explain what usually matters for your project, and help you decide on a useful next step — no guesswork or sales pressure.
First, what kind of property are we planning for?