Renewable Electricity Is Not All Our Energy: Reading Australia’s New Report
Two headlines can give different renewable percentages without either being wrong. One may describe electricity generation, while the other describes all energy used across the economy.
LLuke CoveLightning Energy10 October 2026 · 4 min read
Two headlines can give different renewable percentages without either being wrong. One may describe electricity generation, while the other describes all energy used across the economy.
Australia's latest energy report is a useful reminder to read the boundary first.
I would rather see a clearly labelled figure than a dramatic percentage that quietly switches between electricity, fuels and total energy.
What the new report covers
The Australian Energy Update 2026, released on 25 September, brings together the latest Australian Energy Statistics and an electricity-generation dashboard.
The reporting year and the publication year are different. The update includes 2024-25 energy data; the year in the report title should not be presented as the period for every underlying statistic.
That sounds like a small detail, but it matters when comparing a national annual report with a recent electricity-market record or an instantaneous renewable share.
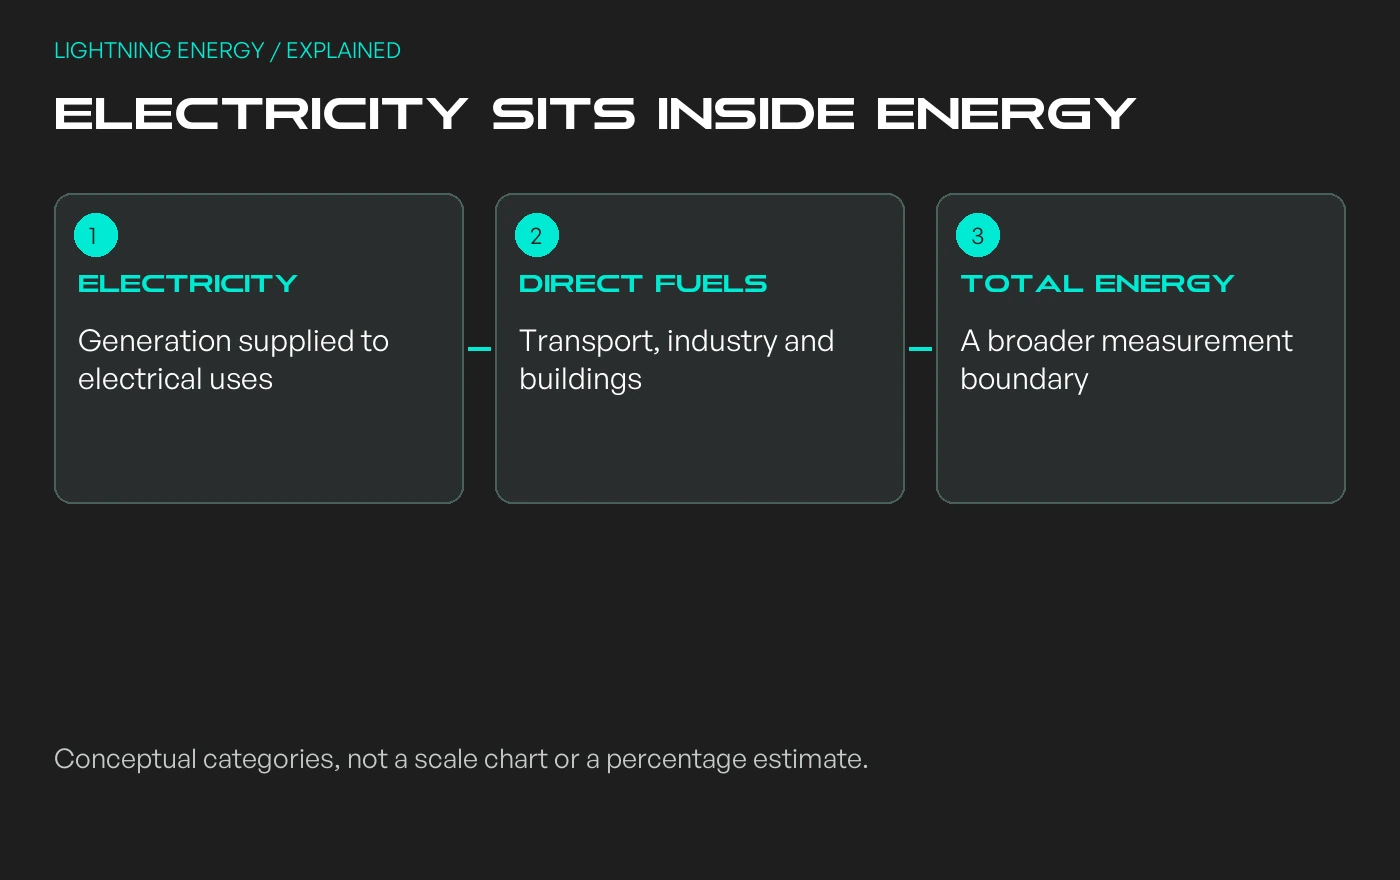
Electricity is used for lighting, appliances, motors and many other services. The wider energy system also includes fuels used directly in transport, industry and buildings.
The government's energy-data collection separates these measures. A renewable electricity share therefore cannot be substituted for a renewable share of all energy consumption.
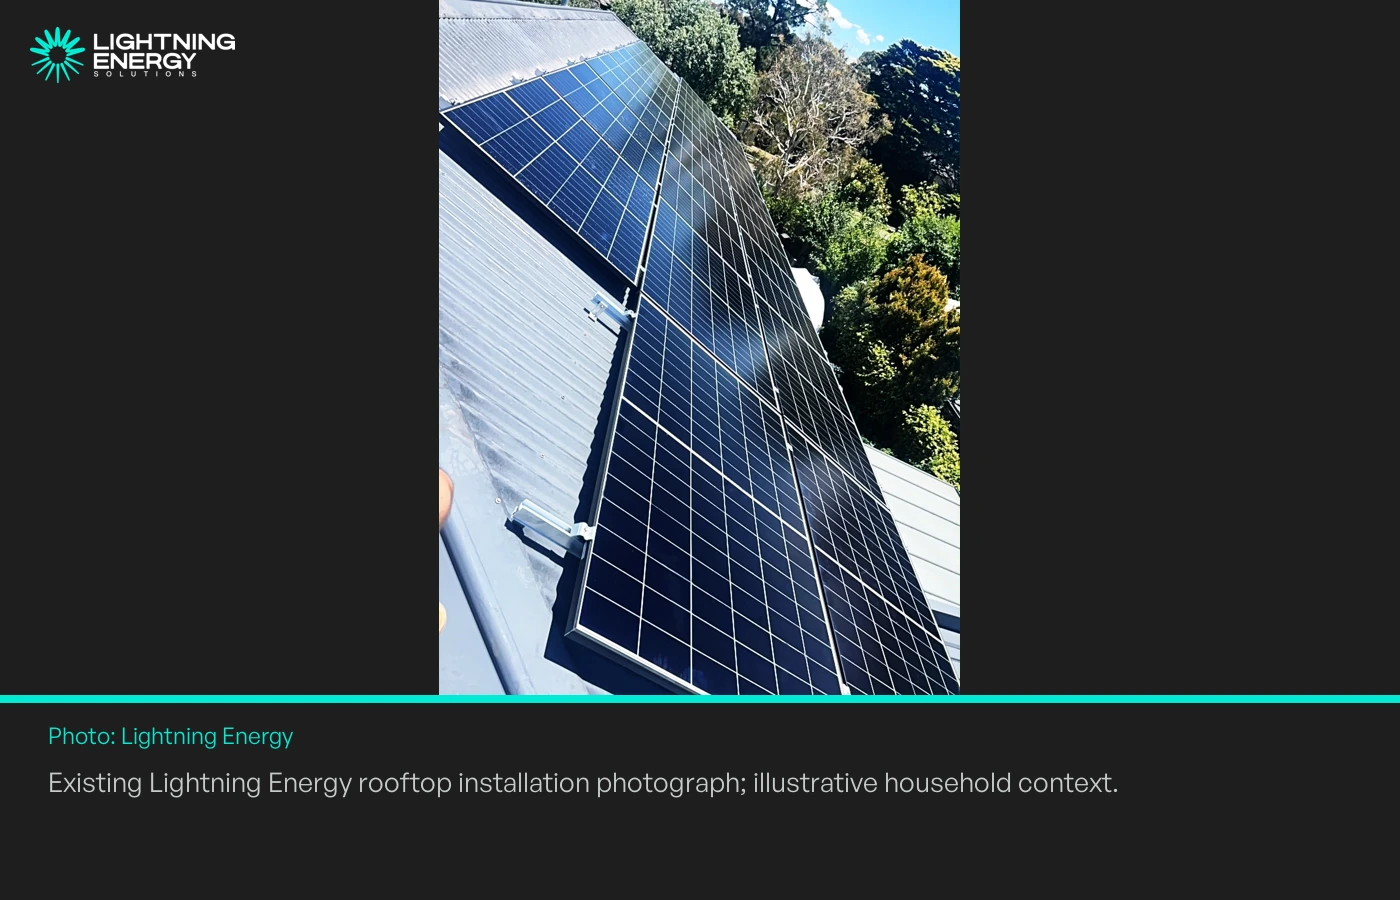
A familiar household example makes the boundary clear: a home can have solar panels while still buying petrol for a car and gas for hot water. Its electricity story does not describe every energy purchase.
Original Lightning Energy graphic. Conceptual categories, not a scale chart or a percentage estimate.
Why electrification changes the comparison
Replacing a fuel-burning appliance with an electric alternative changes both the energy source and potentially the amount of energy needed for the useful service.
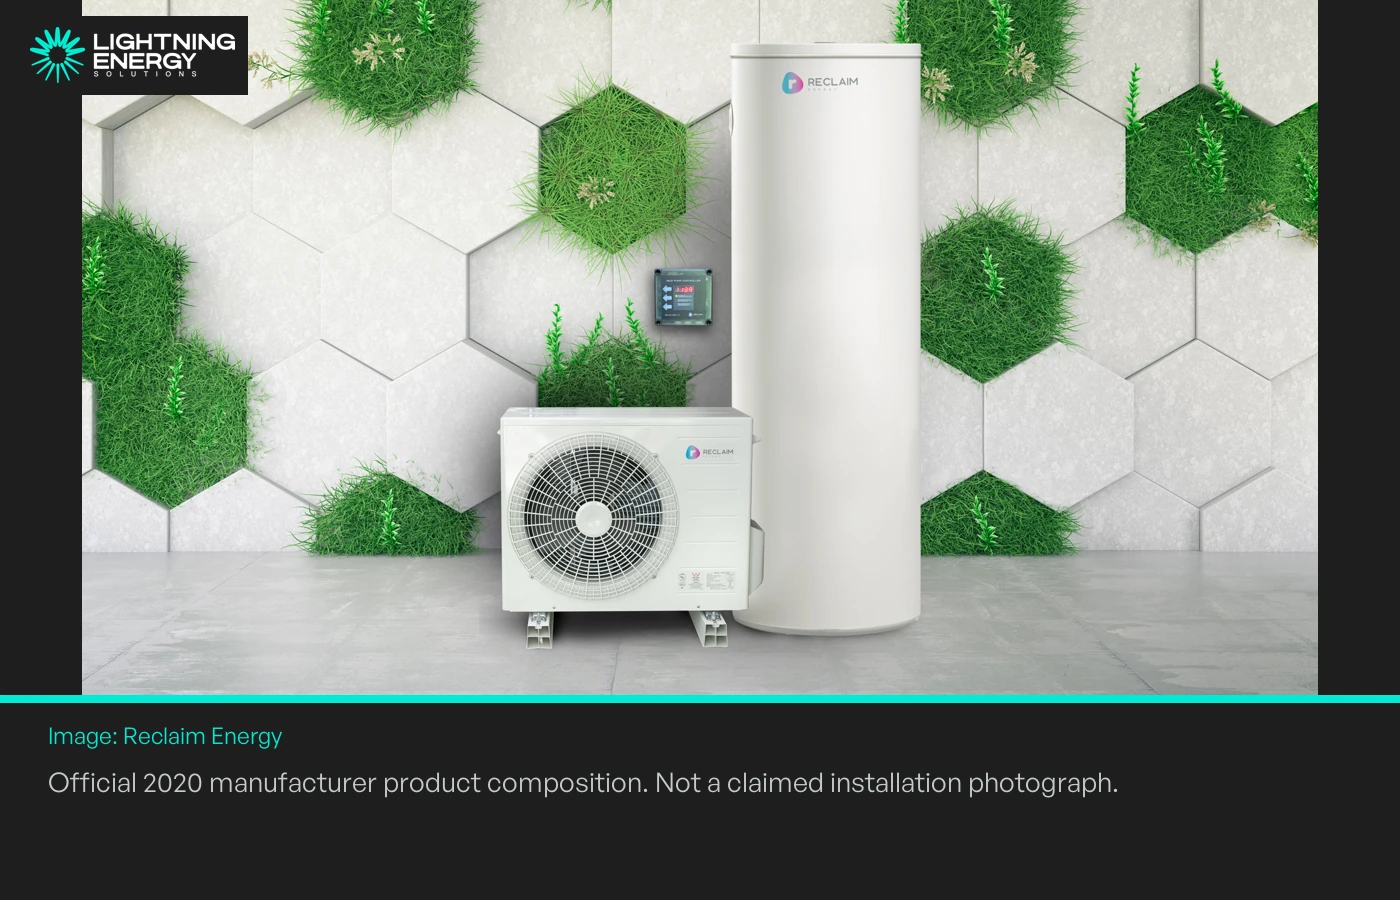
A heat pump moves heat rather than producing all of its heat by direct electrical resistance. An electric vehicle and a petrol vehicle also convert purchased energy into movement differently.
For that reason, compare useful outcomes such as comfortable rooms, hot water or travel. Simply replacing a unit of fuel with the same numerical quantity of electricity is not a complete performance or cost comparison.
Image: Reclaim Energy. Official 2020 manufacturer product composition. Not a claimed installation photograph. Illustrative household context, not the news project.
A simple way to read the next headline
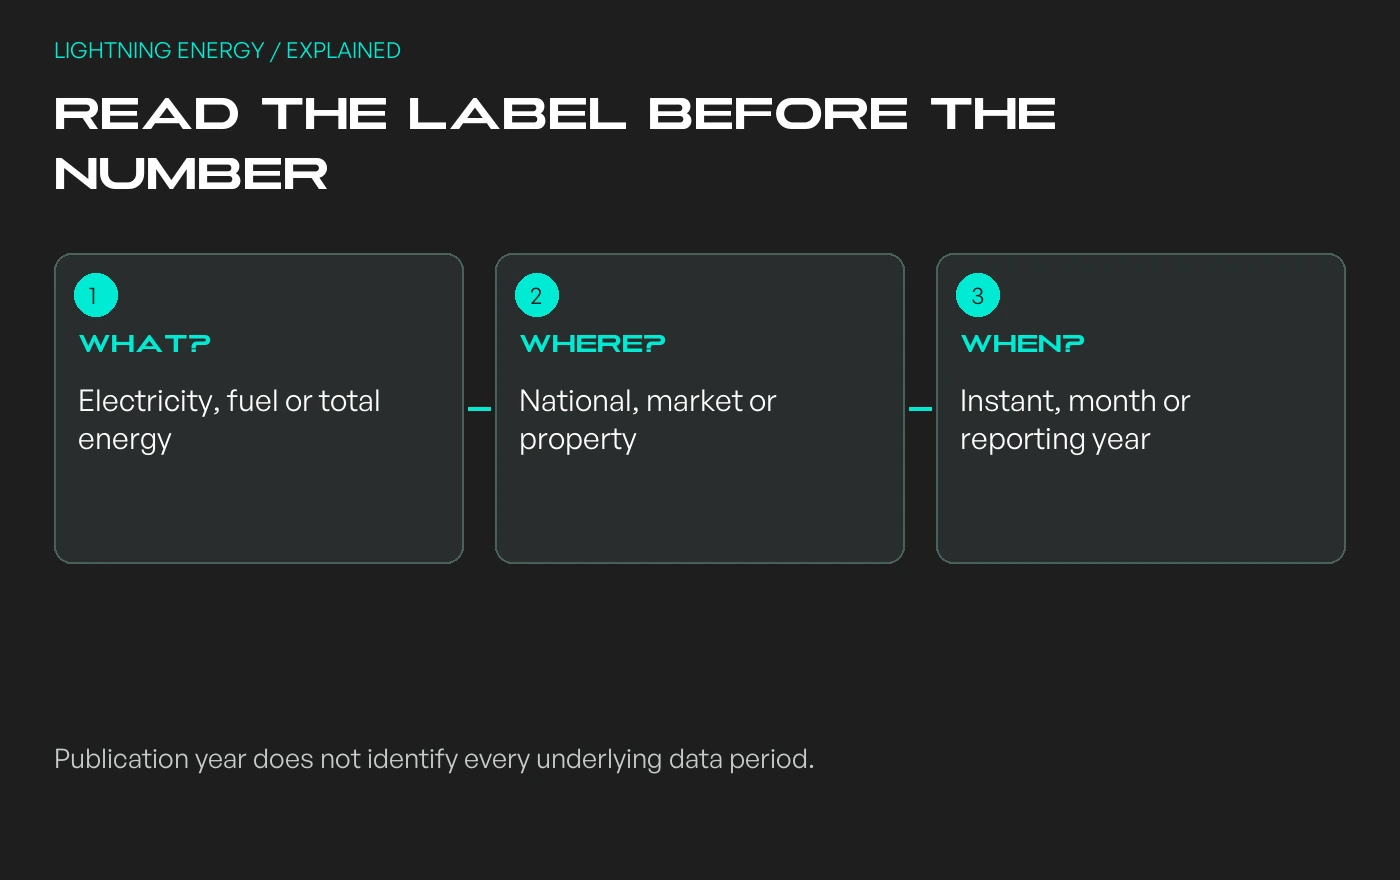
Ask what is being measured, where it is measured and over which period. Is the figure national or limited to an electricity market? Is it an instant, a month or a full year?
For a property decision, break the energy bill into services. Heating and cooling, hot water, appliances and transport can each have a different upgrade pathway and timing.
My recommendation is to use the national report for context and your own bills for the next step. A good upgrade plan connects those two scales without pretending an economy-wide percentage is a forecast for one household.
Research checked 10 October 2026. Project plans and policy timelines may change. The linked sources distinguish announcements, proposals and operating results.
Book a consultation and we'll map solar, storage, hot water, and the rebates around your bills and your goals.
Loading consultations…
Lightning EnergyPlan your next energy upgrade.
⚡
Hi, I’m Lightning Energy’s project guide. I’ll ask a few practical questions, explain what usually matters for your project, and help you decide on a useful next step — no guesswork or sales pressure.
First, what kind of property are we planning for?