
Texas Solar Growth: What the ERCOT Data Shows
Solar and battery capacity are growing in Texas. The published data tells a more specific story than headline predictions.
Solar and battery capacity are growing in Texas. The published data tells a more specific story than headline predictions.
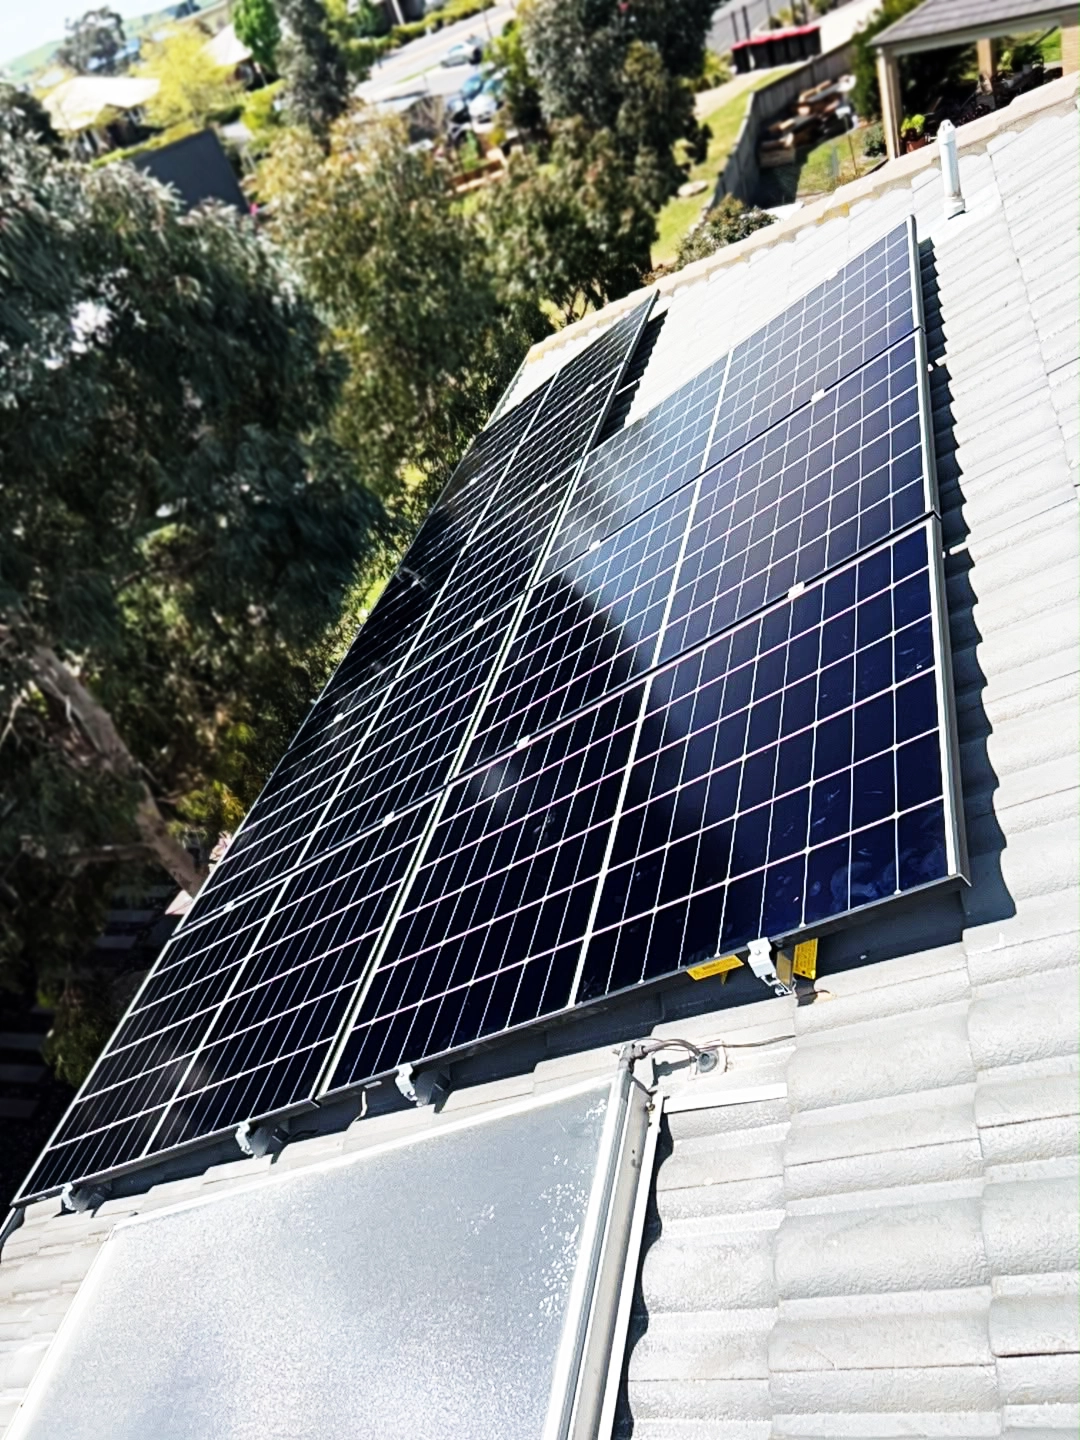
Solar’s growing role in Texas provides a useful energy-market case study. It is more informative to look at the system operator’s measurements and official forecasts than to treat a prominent person’s prediction as a result.
In its May 2026 outlook, the US Energy Information Administration forecast ERCOT solar generation of 78 billion kWh for 2026, compared with 60 billion kWh from coal. These were projected annual totals, not a final measurement of the whole year.
The distinction matters whenever a headline says one technology has overtaken another. It might refer to a momentary output record, one month, installed capacity or annual energy. Those are different comparisons.

The useful question is how a power system accommodates changing production across the day. Solar output, demand, transmission capacity, storage and dispatchable generation interact. A result from Texas does not establish the size or economics of a household system in Australia.
For a home, the equivalent comparison is simpler: how much energy does the property use when solar is available, and how much does it import later? A battery can shift some energy between those periods, but its value needs to be tested against its installed cost and the household tariff.
Contact Lightning Energy to discuss the options for your property and electricity use.
Available times
Book a consultation and we'll map solar, storage, hot water, and the rebates around your bills and your goals.
Question 1 of 6