
Why Your Melbourne Solar Output Drops in Winter and What to Check
Separate normal winter solar changes from missing app data, lower exports and possible faults. A practical Melbourne checklist for what to record and when to call.
Separate normal winter solar changes from missing app data, lower exports and possible faults. A practical Melbourne checklist for what to record and when to call.

A lower solar total in a Melbourne winter does not automatically mean something has failed. But an unexpected drop should not be waved away with 'it's just winter' either.
I would separate three questions: is the system generating less, is the app reporting less, or is the household exporting less? They can look similar on a phone and mean very different things.
Start with the generation record for your solar system, not just the credit on the electricity bill. That gives you a better basis for deciding whether to monitor the pattern or arrange an inspection.
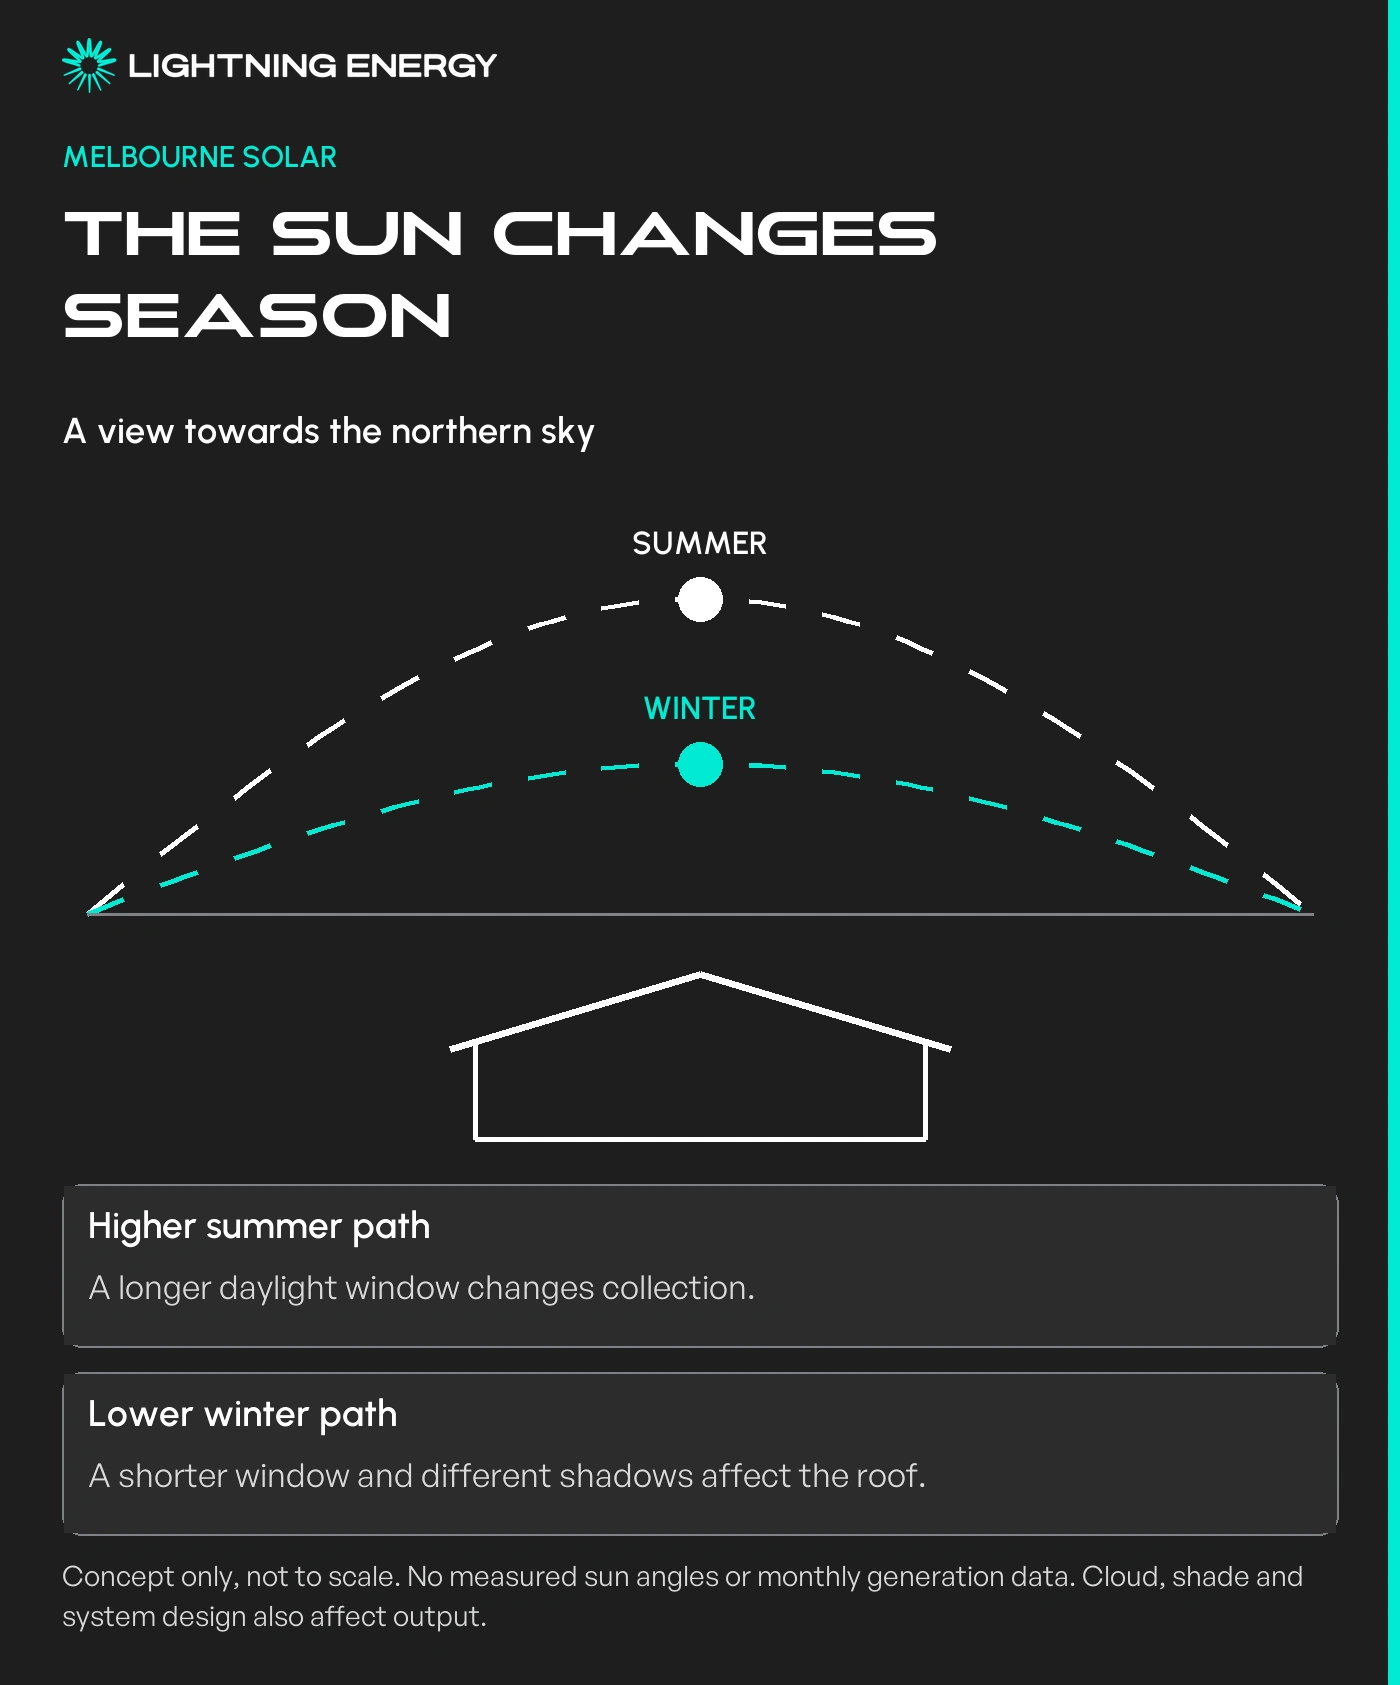
Melbourne's winter sun follows a lower path and the daylight window is shorter than in summer. Your panels have a different opportunity to collect sunlight, even when the equipment is working normally.
A lower sun can also bring shadows onto panels that were clear in summer. Trees, chimneys and neighbouring buildings matter at the times their shadows reach the array.
Your Home's explanation of seasonal sun angles.
Cloud changes the sunlight reaching the roof from day to day. The useful comparison is your system under reasonably similar seasonal and weather conditions, not a dull June afternoon against a clear January afternoon.
Solar panels use sunlight rather than needing hot air. High panel temperatures can reduce efficiency, so a cool bright day can still be productive. Cooler weather does not remove the effect of shorter days and shade.
Your Home's guide to rooftop solar.
The live kW number shows power at that moment. A daily kWh total shows energy accumulated during the day. Passing cloud can move the live number without explaining the whole day's result.
Australian Government explanation of solar power and energy.
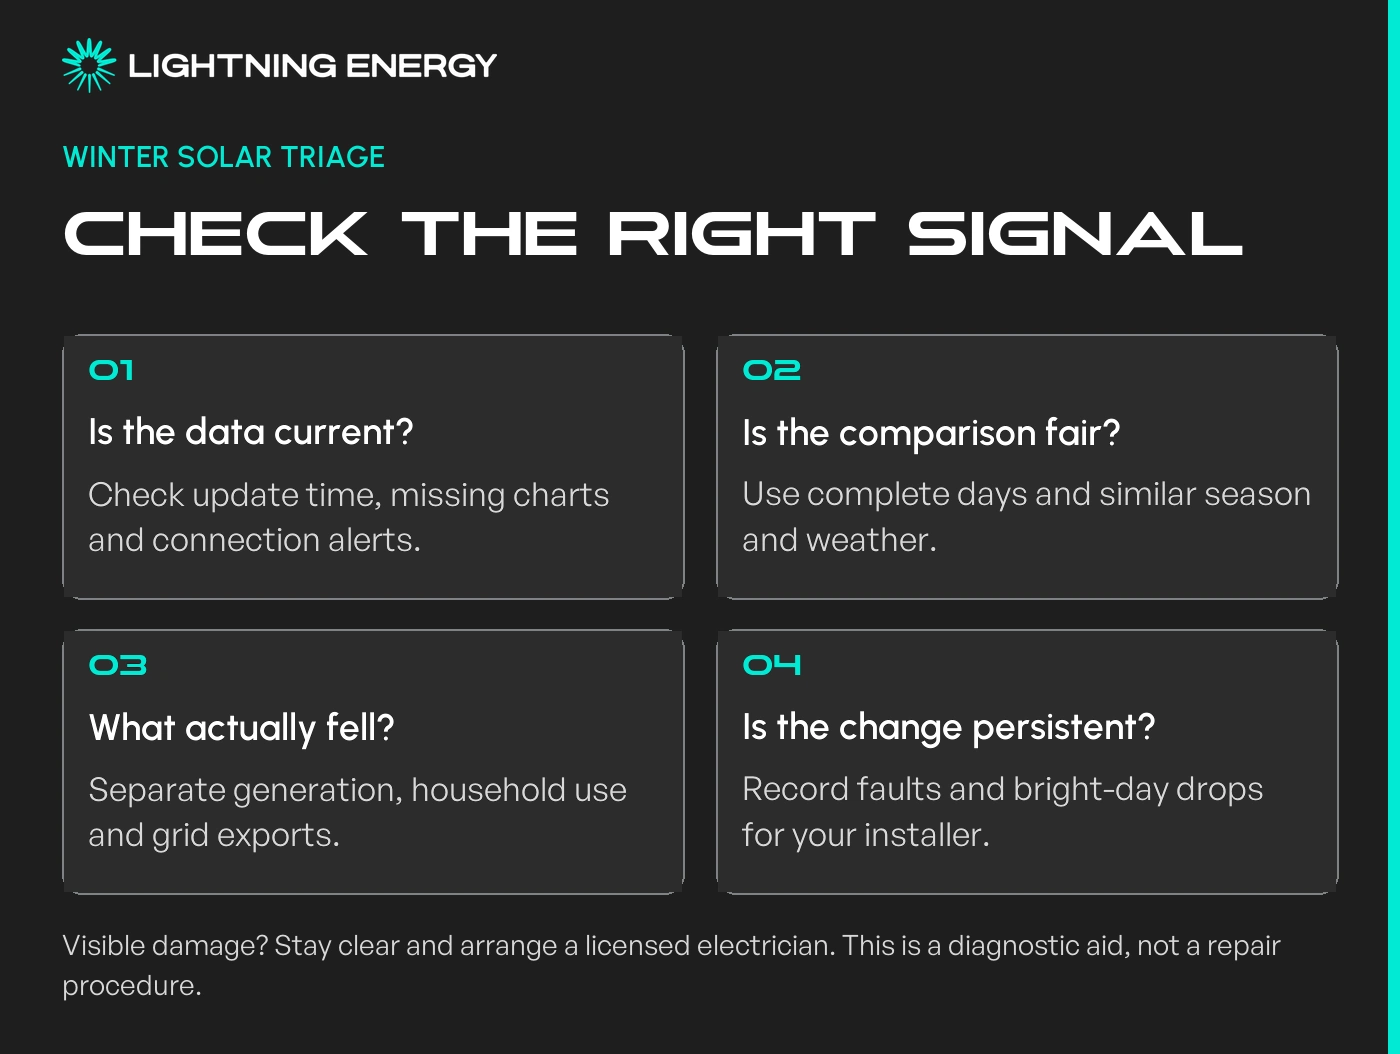
I would start with complete daily totals and then look at the pattern over several days. Record which days were bright, changeable or heavily overcast. Keep the original chart rather than just a cropped low reading.
Where you have a previous year's record, compare the same part of the year. Allow for different weather, changes to the installation and missing data. Last year's total is a reference, not a guaranteed minimum.
Monthly totals also cover different numbers of days. Looking at average daily generation alongside the monthly total makes that comparison easier to interpret.
Solar used inside the home does not all reach the grid. More daytime heating, hot-water recovery or battery charging can leave less to export even when generation has not fallen by the same amount.
A credit also depends on the retailer's rate. Look at exported kWh separately from the dollar credit before concluding that a smaller payment means the panels are underperforming.
The government's solar tariff guide explains that distinction. Your actual retail plan determines the value of exports.
Our export-limit explainer covers another possible constraint. Connection controls can affect output, but a flat chart alone does not identify the cause.
Look for the last update time, a connection warning and missing sections in the chart. If monitoring has stopped communicating, an empty app graph is not enough to prove the panels stopped generating.
The government monitoring guide describes the connection and data each system may provide. Monitoring capabilities vary with the installed equipment.
If an inverter display can be read safely from ground level without opening anything, record its status and any error code. Send that with the app screenshot. Do not change electrical or protected network settings to investigate.
For background on what the equipment does, our inverter guide separates the main system types. Knowing the exact model helps the installer interpret an alert.
A persistent fall on otherwise bright days, repeated error messages or a sudden change from the established pattern deserves investigation. You do not need to diagnose the component before reporting the change.
Australian Government advice when solar output looks wrong.
Keep the dates, complete charts, weather notes and any recent changes together. Mention a new tree shadow, roof work, a changed internet router or altered battery settings if relevant. These are clues, not a diagnosis.
If there is visible damage, keep away from the equipment and cables and arrange a licensed electrician. Solar can remain electrically hazardous in daylight even when household power is turned off.
Energy Safe Victoria's guidance on damaged solar equipment.
Servicing is more than cleaning panels. Energy Safe Victoria recommends servicing at least every two years by a licensed electrician.
Energy Safe Victoria's home solar servicing guidance.
If the seasonal pattern is consistent and there are no fault signs, keep monitoring and review when flexible appliances run.
Hot-water timers are one place to consider the shorter solar window.
I would not buy extra panels, a battery or a cleaning package solely because one winter bill was disappointing. First establish whether the issue is weather, demand, monitoring, a system constraint or a fault.
If output remains unexplained, contact Lightning Energy with the inverter model and your records. A specific account of what changed is much more useful than trying to hit a generic Melbourne daily-generation number.
Available times
Book a consultation and we'll map solar, storage, hot water, and the rebates around your bills and your goals.
Question 1 of 6