
17.5 GW From Rooftops: A New High for the Main Grid
Rooftop solar hit an estimated 17.488 GW across the NEM on 11 October. What the record means for storage, grid flexibility and getting more from solar at home.
Rooftop solar hit an estimated 17.488 GW across the NEM on 11 October. What the record means for storage, grid flexibility and getting more from solar at home.

Australia’s rooftops have cleared another milestone. A new estimate puts their combined output across the National Electricity Market at 17.488 gigawatts, raising a practical question: how do we make more of that daytime electricity useful?
For households, the answer starts with timing. A bigger national peak does not automatically mean a bigger export payment, a cheaper electricity plan or a reason to buy the largest battery available.
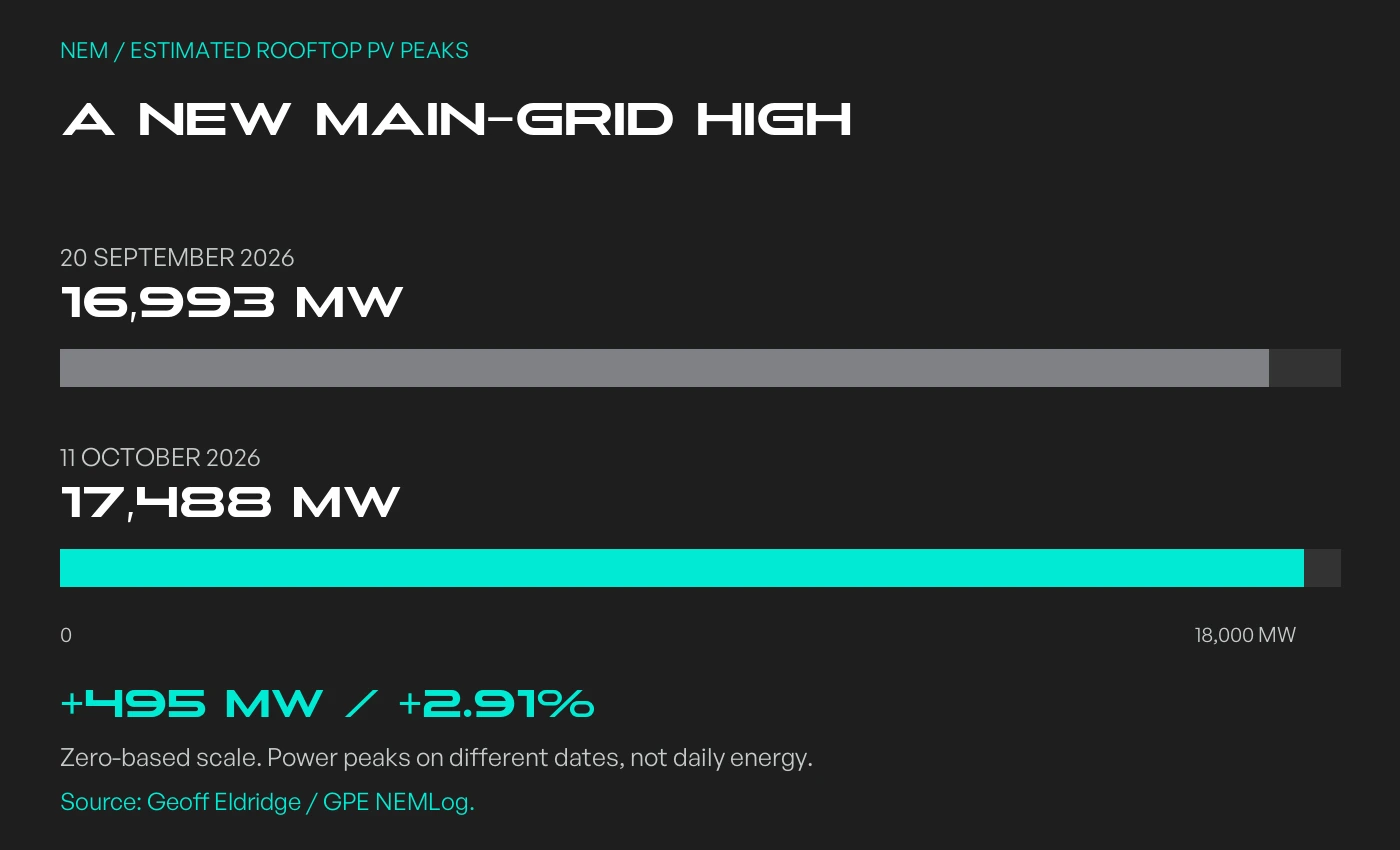
Geoff Eldridge’s GPE NEMLog analysis puts rooftop PV output at 17,488 MW at 12:00 AEST on 11 October 2026. The previous high was 16,993 MW on 20 September: a rise of 495 MW, or about 2.91%.
These are estimated instantaneous output records, not measured daily energy totals. The source uses AEST; that is 1 pm in Melbourne and Sydney during daylight saving.
See Eldridge’s primary record announcement.
RenewEconomy’s 12 October report.
The NEM covers Queensland, NSW, the ACT, Victoria, South Australia and Tasmania. It does not include Western Australia or the Northern Territory, so this is a main-grid record rather than an all-Australia electricity total.
Source: AEMO’s National Electricity Market overview. AEMO also describes rooftop output as an up-scaled estimate in its solar forecasting documentation.
That distinction is useful at home too. Kilowatts describe a rate of production or consumption. Kilowatt-hours describe energy accumulated over time. A brief peak cannot tell you what a system generated over an entire afternoon.
Our SA and Victoria rooftop-records article covered the 7 October milestones. This national update concerns the later 11 October NEM peak.
It is tempting to add up record state readings. That would be misleading when they occurred at different times. A national peak is a reading for the whole relevant system at one interval, not a collection of each region’s best moments.
Eldridge’s separate analysis reports a Victorian renewable-curtailment peak of 5,709 MW at 12:15 AEST on 11 October. Curtailment here means estimated available renewable output that was not dispatched.
It is not a measurement of how much every household inverter reduced its output. The analysis cannot separately quantify behind-the-meter rooftop curtailment or the full contribution of household batteries.
Source: Eldridge’s analysis of the record-breaking weekend.
The rooftop and Victorian curtailment peaks occurred 15 minutes apart.
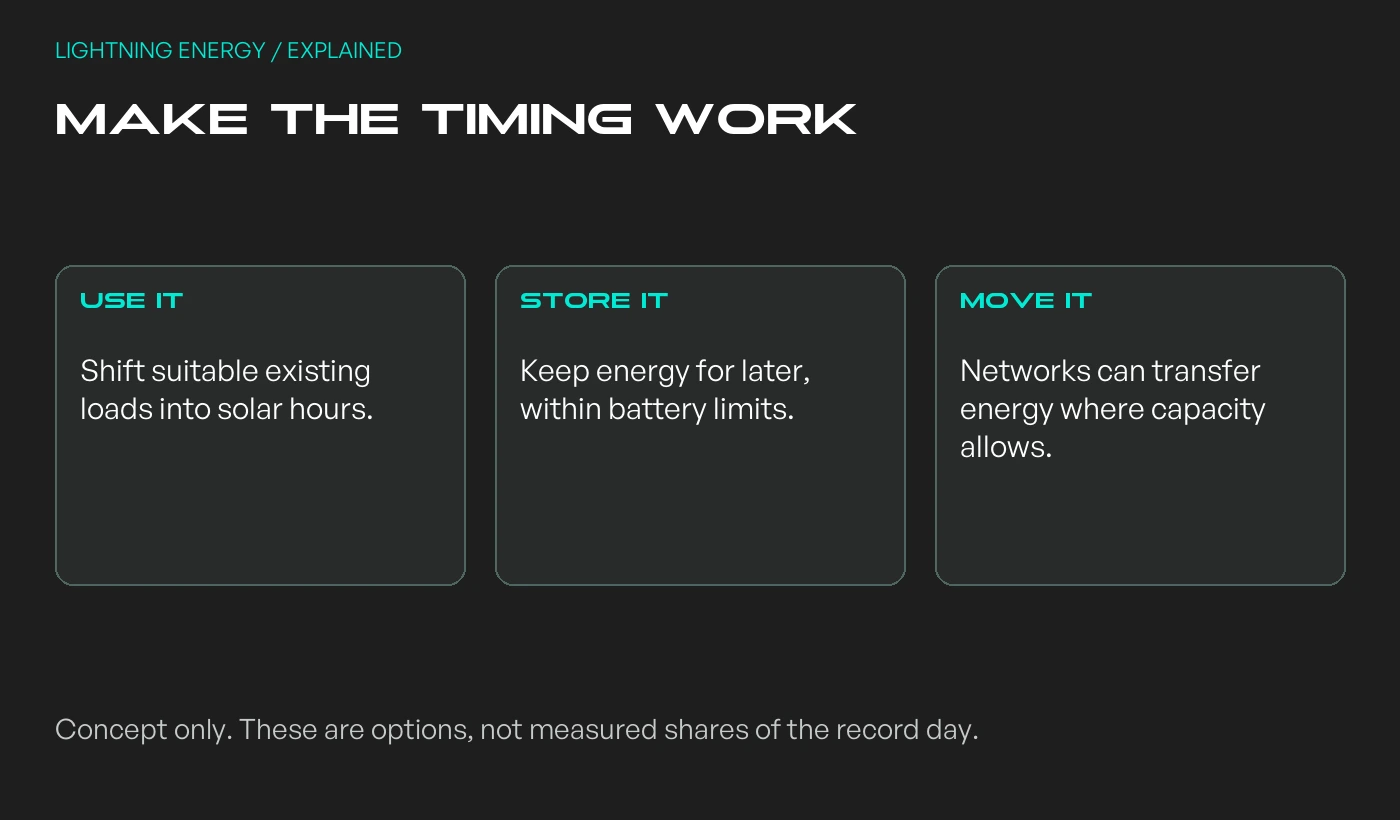
Our interpretation is that these figures make flexibility more relevant, but they do not establish the size or location of a storage investment. Electricity has to be usable where and when it is available.
A battery with spare capacity can absorb some energy. A full battery cannot keep charging indefinitely. Transmission, equipment limits, demand and operating conditions also affect what the system can accommodate.
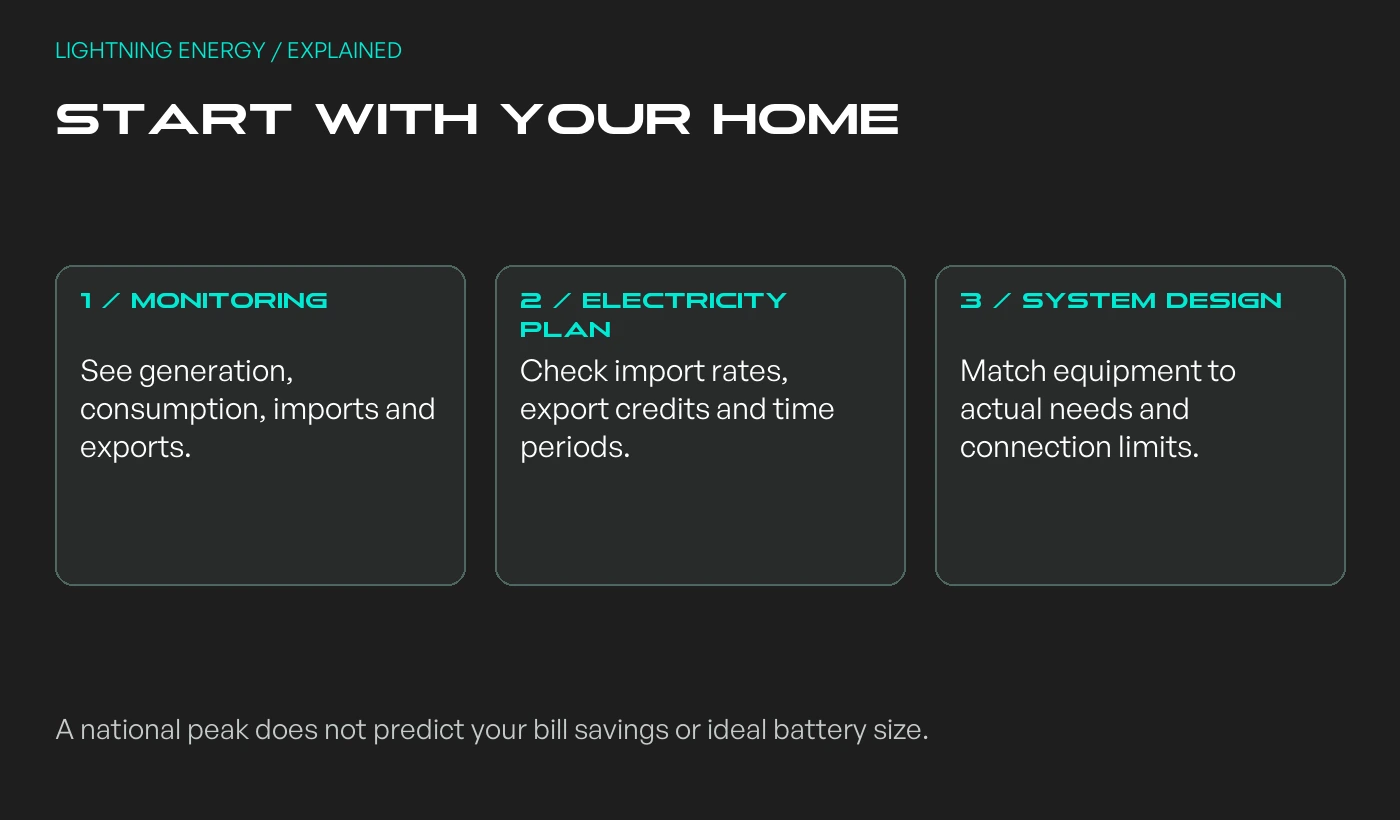
Start with a week of your own data. Look at solar production, household use and imports or exports together. If you have a battery, include its charge level and the times it charges and discharges.
A generation-only display cannot answer every question. Ask whether your monitoring measures whole-home consumption. Otherwise, the missing view may be the reason you cannot explain the electricity bill.
The Australian Government’s solar monitoring guide explains the information a suitable monitoring system can provide.
Then consider loads you already need to run. Can laundry or dishwashing sensibly move into a sunny period? If hot water has suitable controls, could its operating window better match your production and household needs?
Keep appliance safety controls and manufacturer requirements active. A solar-friendly schedule should still deliver hot water when needed and suit the people living in the house.
Government guidance on getting more from solar supports matching consumption to generation.
There is no need to create extra consumption simply to avoid exporting.
For anyone considering home batteries, the useful questions are about the property: how much surplus is available, when electricity is imported, and what storage is meant to achieve.
Usable energy capacity, charging power and backup functionality are separate specifications. An attractive capacity number is not enough to establish that a system suits the home.
Check the electricity plan too. Import rates, export credits and time-of-use periods affect the value of storing energy. Installation cost, losses and warranty terms belong in the comparison, not just a sunny-day screenshot.
The government guide to solar and battery bill savings explains why self-consumption and the applicable tariff matter.
Savings remain household-specific.
The new peak is a useful milestone in the main grid’s changing electricity supply. For an individual home, the next step is more practical: understand the existing system before choosing an upgrade.
If you are comparing rooftop solar, ask for an expected production profile alongside the connection conditions. If hot water is part of the plan, consider how a heat pump would fit the home’s daily routine.
Lightning Energy can help assess those decisions together. The aim is a system that suits your consumption, roof and approved connection, with clear assumptions about what it can and cannot deliver.
Checked 13 October 2026. Record figures are attributed to GPE NEMLog; this is original Lightning Energy commentary, not an independent re-analysis of raw dispatch data.
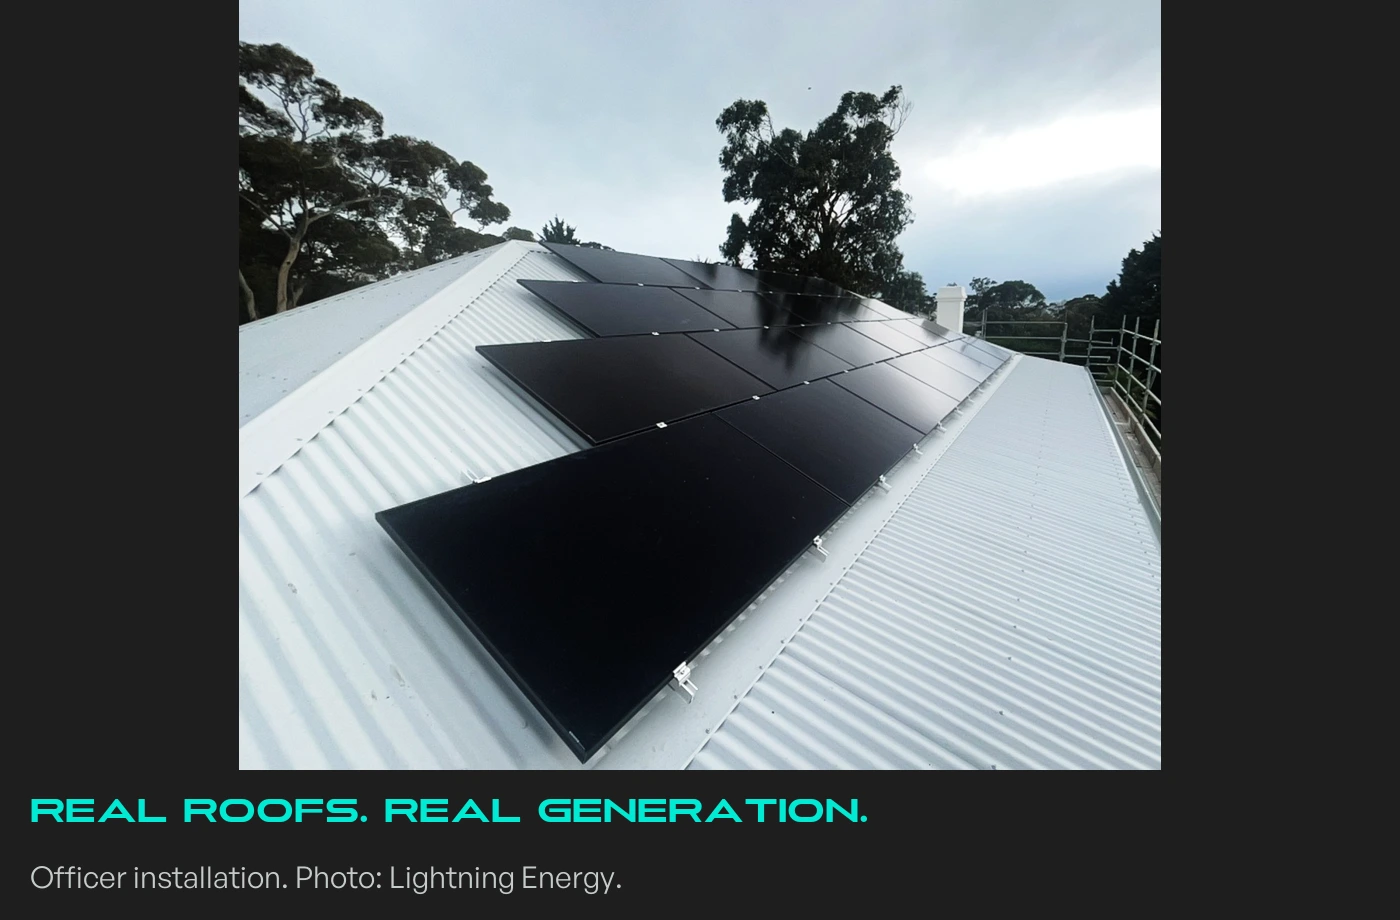
Photography is from our installation library; all graphics are original.
Available times
Book a consultation and we'll map solar, storage, hot water, and the rebates around your bills and your goals.
Question 1 of 6