
Rooftops Break Records: Where Does All That Solar Go?
South Australia and Victoria reached new rooftop-solar peaks on 7 October. Here is what the records measure, what home batteries change, and what solar owners should check.
South Australia and Victoria reached new rooftop-solar peaks on 7 October. Here is what the records measure, what home batteries change, and what solar owners should check.

The next big power station is already spread across thousands of roofs. New rooftop-solar output records in South Australia and Victoria show just how much electricity households and businesses can produce together.
But a record on a generation chart leaves an important question unanswered: how much of that solar was used inside properties, stored in home batteries or exported to the network? Those are different flows, with different implications.
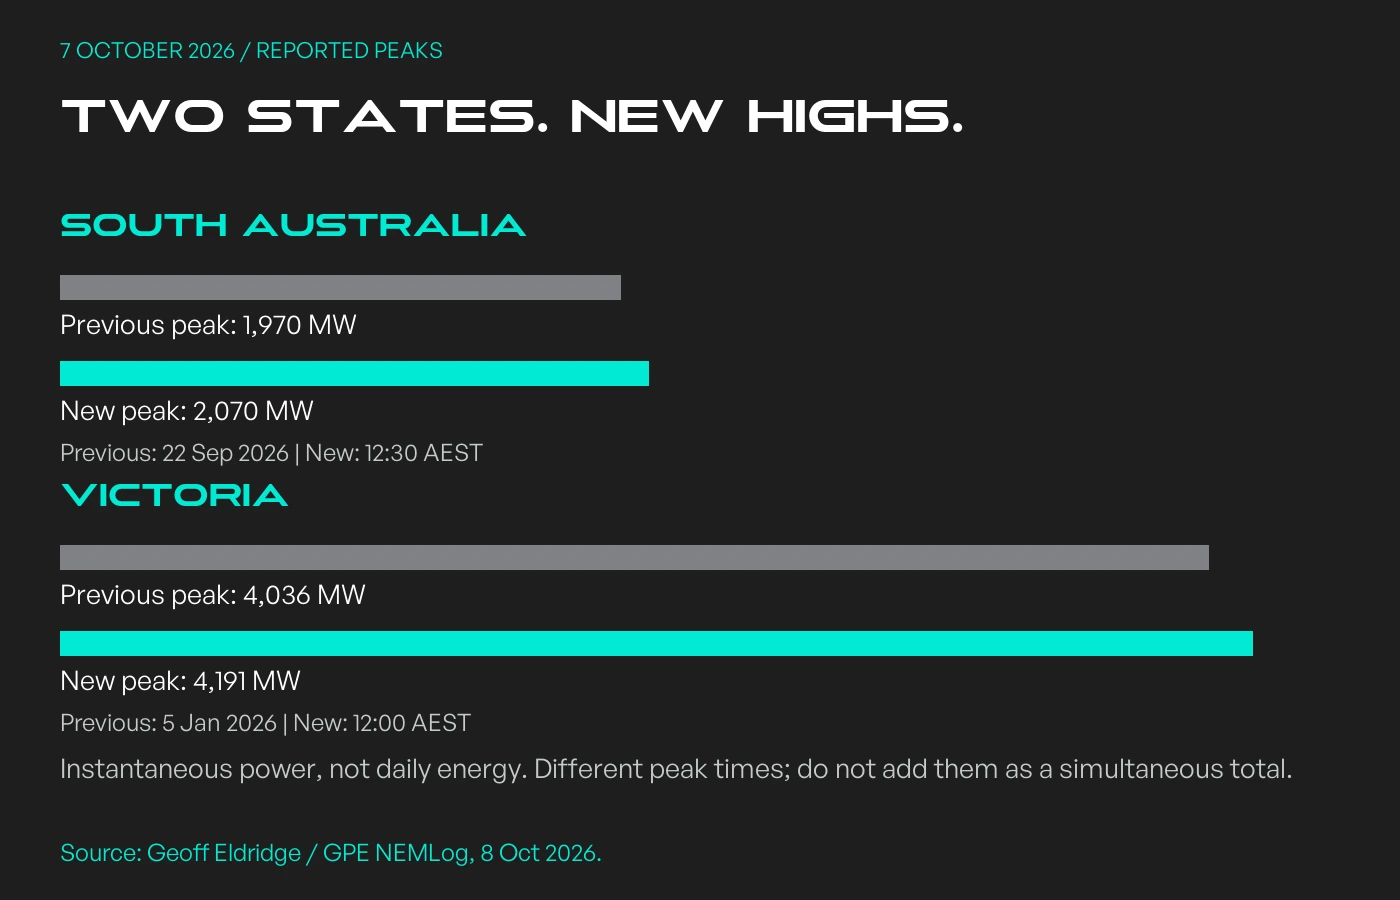
Geoff Eldridge’s GPE NEMLog analysis reports South Australian rooftop output reaching 2,070 MW at about 12:30 AEST on 7 October 2026. Victoria reached 4,191 MW at 12:00 AEST that day.
The previous reported highs were 1,970 MW in SA on 22 September and 4,036 MW in Victoria on 5 January. These are instantaneous output estimates, not records for the amount of energy generated over a whole day.
Source: Geoff Eldridge’s GPE NEMLog record analysis.
Times are in the source’s AEST convention, not local daylight-saving time.
Sophie Vorrath covered the development in RenewEconomy’s 8 October report.
Our chart below presents the reported comparisons in an original layout.
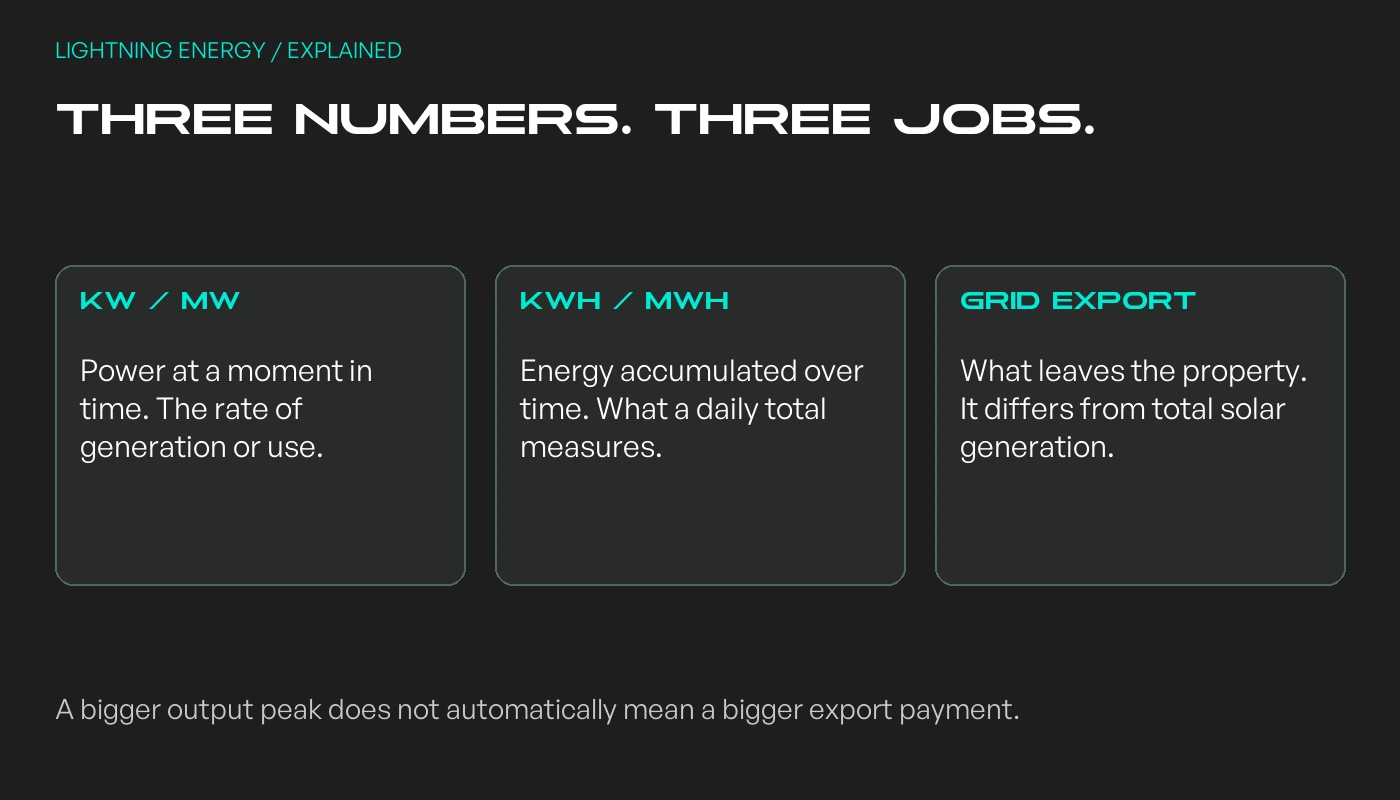
A peak tells you how fast electricity was being generated at a particular moment. Daily energy tells you how much was generated across the day. A brief high reading and a long, steady output profile are different things.
For a simple example, a system producing 5 kW steadily for two hours generates 10 kWh. This is arithmetic, not a forecast for a real roof: clouds, orientation, temperature and equipment limits change the actual profile.
That distinction matters when reading an app or a headline. A high kW number can be interesting, but your household planning also needs energy totals and the timing of consumption.
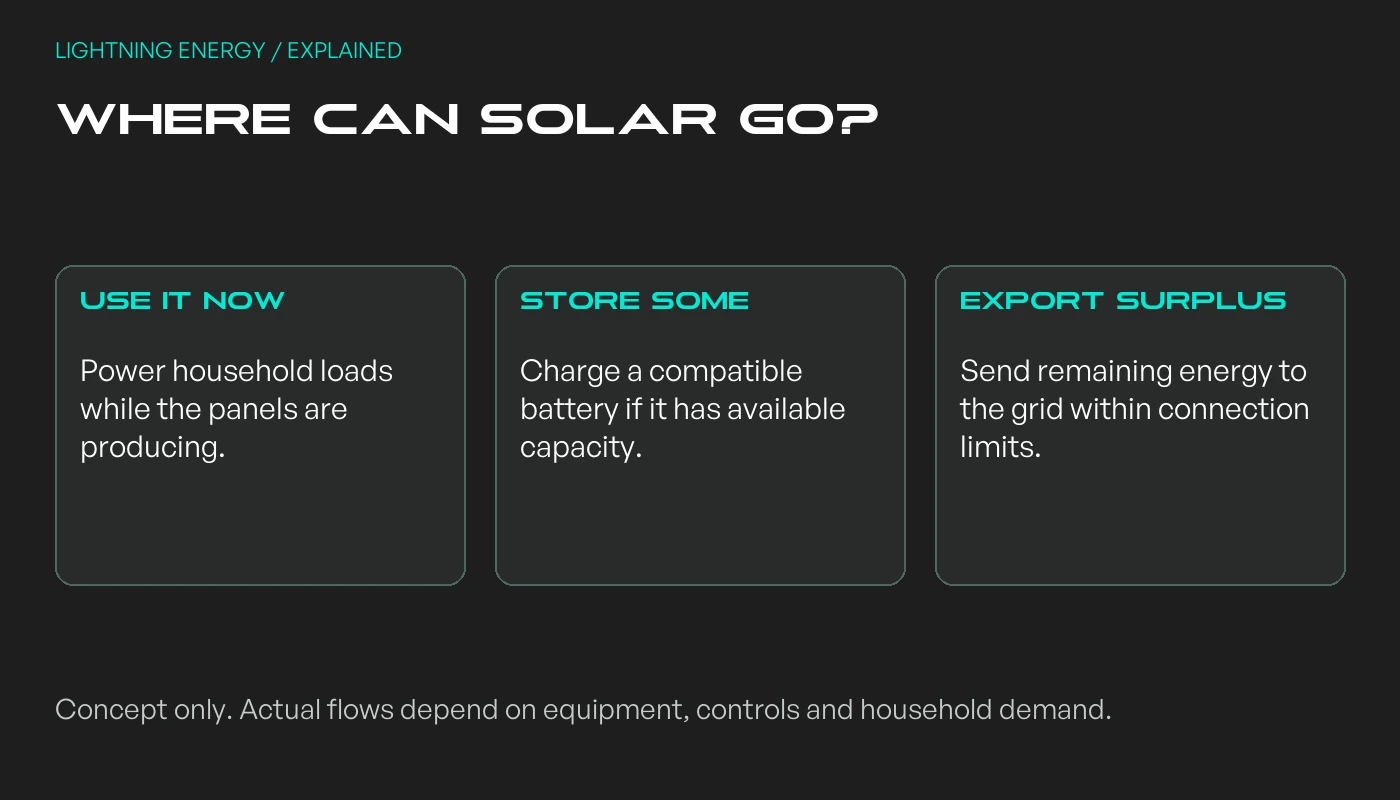
Solar can supply appliances before any surplus crosses the property boundary. A battery can absorb energy, hold it and release it later. The net flow through the electricity meter is therefore different from total generation on the roof.
Imagine an illustrative moment with 5 kW of solar output, 2 kW of household use and 2 kW going into a battery. Ignoring losses, the remaining 1 kW would be available for export if the connection allows it.
The panels have not stopped producing 5 kW simply because the export reading is 1 kW. The difference is being used on site. This example explains the flows; it is not a measurement from the record-setting day.
Eldridge flags an important limitation: the available grid and rooftop estimates do not establish the total charging or discharging of household batteries at the record peaks. The exact contribution remains unquantified in that analysis.
Separate evidence from AEMO shows why household storage matters. Its Q2 2026 analysis compared samples of 10,000 solar-only homes and 10,000 homes with solar and batteries, within the report’s stated eligibility criteria.
The battery group tended to start net exports later in the morning and showed lower evening net imports than the solar-only group. That is consistent with batteries changing when homes exchange electricity with the network.
Source: AEMO Quarterly Energy Dynamics, Q2 2026, pages 11–12.
These sample results describe a separate period and cannot quantify the batteries’ effect on 7 October.
Our view: it is reasonable to discuss storage as part of the changing grid. It is not reasonable to turn an incomplete picture into a precise claim about how much every home battery reduced demand on that particular day.
A state-wide generation record does not tell you how much a particular street or property can export. Your distributor’s connection conditions and the equipment at your site still apply.
SA Power Networks explains that flexible export access varies with network capacity, installed equipment and electricity use. A flexible limit can change; it is not a promise that the highest permitted export level is always available.
Source: SA Power Networks’ solar and export guidance. Other states and distributors have their own arrangements, so use the requirements for your address.
For rooftop solar, ask for the approved export limit and the expected generation profile to be explained separately. More generation and more export capacity are not the same purchase.
Start with three views: solar production, household consumption and imports or exports. If you have storage, add its charge level and charge/discharge history. Compare a sunny day with a cloudy day and an ordinary weekday with a weekend.
This is a useful way to frame questions for your installer. Does the home buy most electricity after sunset? Is surplus generation regularly available? Does the system’s monitoring capture the whole property, or only the inverter?
If you are comparing home batteries, those patterns help define the job you want storage to do. Battery size alone does not establish suitable power output, backup capability or likely financial benefit.
A record is a milestone, not a household operating instruction. Our practical approach is to start with what the home needs, then consider which existing loads can sensibly run during solar production.
A compatible heat-pump hot-water system or EV charger may offer scheduling options. Suitability depends on the equipment, household routine and tariff; keep required safety and appliance controls active.
The broader story is about timing as well as scale.
Our companion article on batteries and midday electricity prices explains how storage is also changing the wholesale market.
For solar owners, the most useful question is simple: where does our electricity go, and does the system fit how we live? That is a better starting point than assuming a state record guarantees a particular saving at home.
Original Lightning Energy analysis, checked 9 October 2026. Record figures are attributed estimates. Photographs come from Lightning Energy’s installation library; the chart and explanatory graphics are original.
Available times
Book a consultation and we'll map solar, storage, hot water, and the rebates around your bills and your goals.
Question 1 of 6